
Bitcoin and Ethereum Lose Ground in Overnight Trading: Market Analysis, Sep. 18
Sep 18, 2018, 12:22PMBitcoin and Ethereum led the losers chart heading into early Tuesday trading, on the back of an overnight selloff in the crypto market.
After holding steady onto some of the gains made late last week, the top cryptocurrencies shed some ground in overnight trading, led by Bitcoin which dropped off from intraday highs of $6,450 to lows of $6,160. Ethereum also joined in the losing train, giving up some of the gains that it had made last week. These moves have caused prices to break below the range of prices that have been seen in the last few days. Bitcoin for instance, which had been trading within the $6,350 to $6,500 range, has now left that range and is heading back to the identified support levels.
So what does the crypto market hold for traders as we head into the middle of the third week of September?
BTC/USD
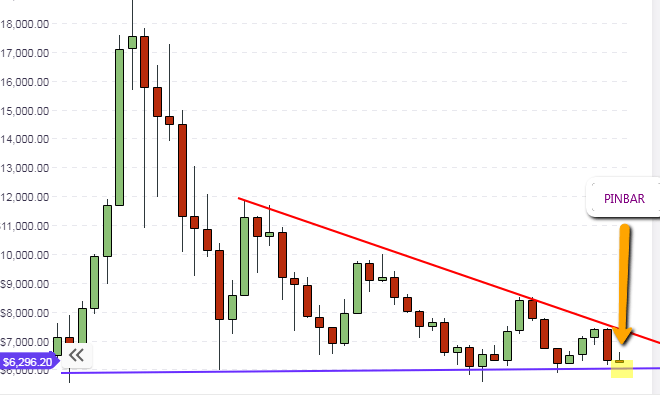
BTC/USD is now heading back to the support levels that have been identified on the weekly chart. The price candle on the weekly chart is presently shaped like a pinbar. This picture could change by the time the week is over. It is therefore pertinent to allow the weekly candle to close at the end of the week before traders will be able to determine what prices moves to make in the long term. However, the support area is still intact.
The daily chart shows the medium term price direction, and we can see that there is a clearly defined medium-term support (blue line) and medium-term resistance (red line). These two lines are converging, giving the impression that a symmetrical triangle is in evolution. Price action is resting on the medium-term support at the $6,206 price level, and as long as this support is not broken by the daily candles, then the support will serve as a good entry point for those who are looking for bargain buying of BTC at the cheapest prices of the moment.
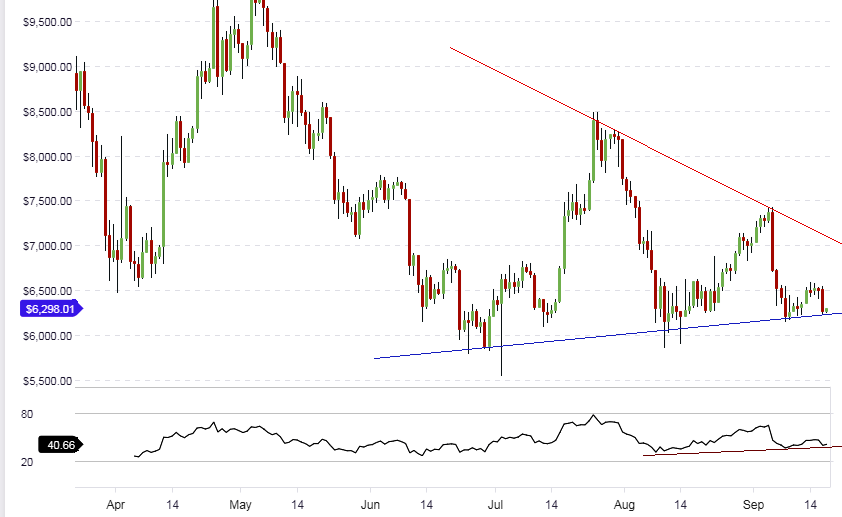
Careful attention must be paid to the candlestick patterns that form at the support area, as they will give a clue as to what price action will be like. If a bullish candlestick pattern forms at this support line, backed up by an increase in buying volume, then prices may pick up. But if a daily candle closes below this support line, then prices may yet dip further to the long-term support seen at $5,800 to $6,000.
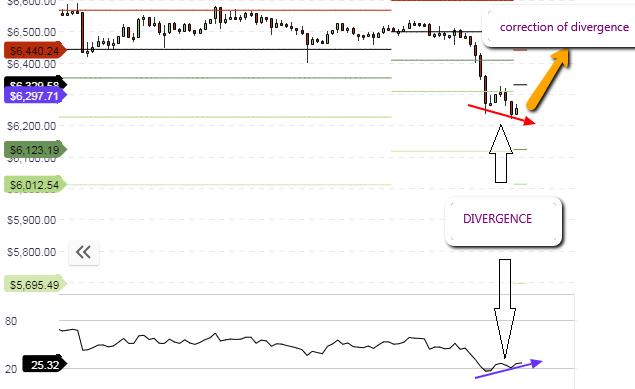
For intraday traders, the focus for trading must be on the pivot points. We see that the RSI indicator has formed what is known as a “failure swing”. The RSI formed a low within the oversold price area, and formed a 2nd low which failed to reach the oversold area, forming a picture of progressively higher lows. When combined with the price action that is showing progressively lower lows, we see a divergence situation. The end point is that price action is expected to correct this divergence, and we may possibly see this happening with price action pushing off from the S1 pivot at $6,190 to attain the $6,300 central pivot price level.
Outlook for BTC/ULong-term
- Long-term: bearish
- Medium-term: neutral
- Short-term: neutral
ETH/USD
ETH/USD started off the week on a bullish note, but has shed some of its gains of last week and is now found at above the $190 mark. This has caused the weekly candle to assume the shape of a bullish pinbar. The weekly candle is therefore sitting on the support line. If the situation stays the same and the support level holds, then ETH buyers may get in at this price and push the crypto upwards.
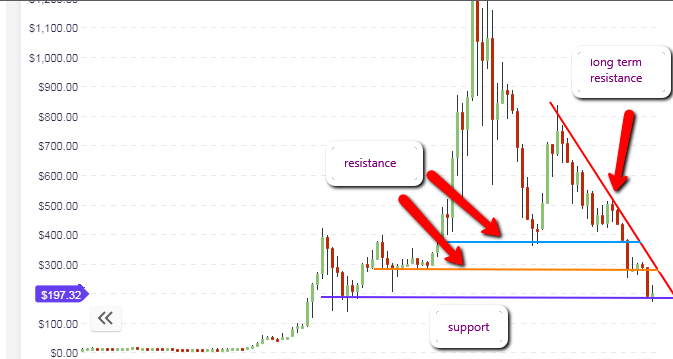
The daily chart shows that the downward price channel is still intact, with price once more heading to the lower channel line after having bounced off it last week. A look at the price action within the channel shows that there may still be room for more downside action before price gets down to the lower channel line. This lower channel line also crosses the horizontal support at $190. This may reinforce this price area as a support.
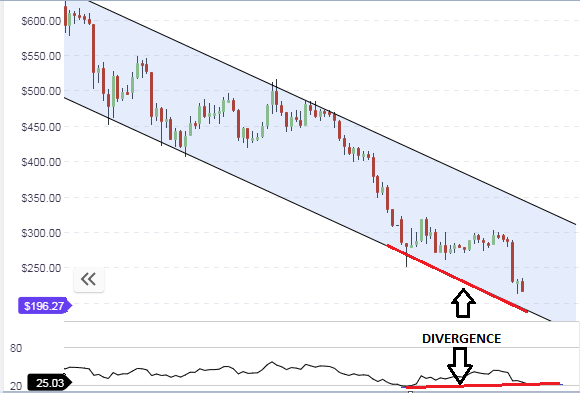
Another interesting picture on the daily chart is the presence of progressively higher lows on the oscillator, and progressively lower lows on the price candles. This indicates a divergence situation which will end up with price correction to the upside. Any upside correction of divergence will have to correspond to a bounce of price action from the lower channel line/horizontal support line.
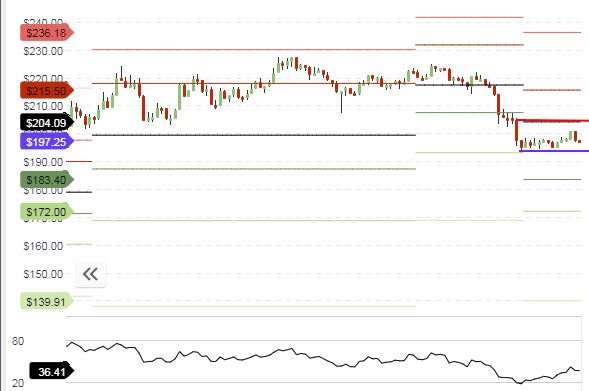
The hourly chart reveals that the price action for the day is presently trading between the central pivot as resistance ($204) and the S1 support at ($193). Price action is expected to range trade between these price levels if there is no strong push by buyers or seller to send prices beyond these price levels. Those who wish to range trade these price levels must ensure that the candles do not break above the central pivot or break below the S1 pivot. Oscillator movements into overbought and oversold areas will provide guidance for such trades.
But if any of these price levels are broken, then traders should trade the breakout by waiting for a price pullback after the break. This will ensure confirmation of the breakout moves beyond the identified intraday price range.
Outlook for ETH/USD
- Long-term: bearish
- Medium-term: bearish
- Short-term: neutral to slightly bullish
EOS/USD
The long term outlook for EOS shows the price action is in a very tight trading range. Prices are presently attacking the support level of $4.85. However, we need to look at some salient features on the weekly chart to understand the long term price movements on EOS.
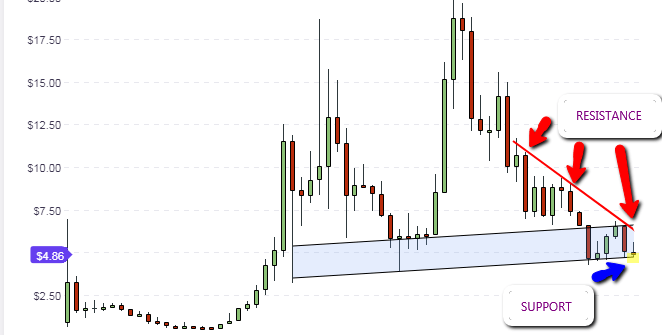
We see that an upward channel has formed on the weekly chart. The lower border of this channel is the present price lows which were also seen in Jan 2018 and April 2018. The upper channel line cuts across an area of previous support formed in April 2018, which was broken and turned into a resistance. This resistance held well to put a cap on the weekly candle that formed in the first week of September 2018. This channel is therefore expected to form the range of price movements heading into October. We should also note the long term descending resistance line that touches the upper channel line. This reinforces the resistance formed by the upper channel line.
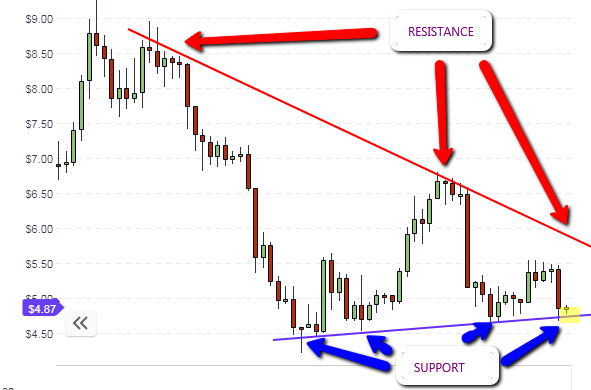
The EOS/USD daily chart shows that price action is capped on both ends by converging trendlines and price action is sitting on the support line. If this support line is not broken to the downside by any of the daily candles that will form during the course of the week, then bulls will see an opportunity to buy EOS at what is perceived to be bargain prices in the market.
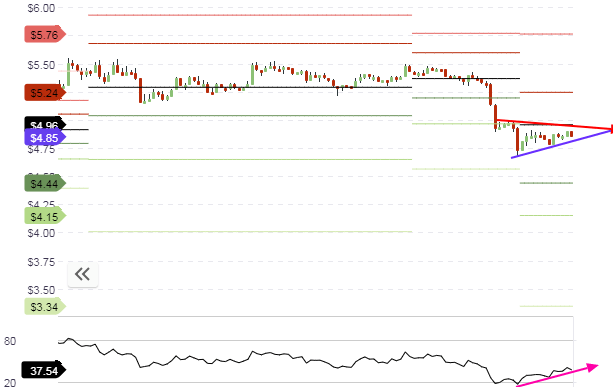
The hourly chart shows price trading within a tight trading range that is capped by the central pivot above, and the S1 pivot below. If price action breaks above or below the identified ranges, then price action will trade out of these ranges.
Outlook for EOS/USD
- Long-term: neutral to bullish
- Mid-term: neutral to bullish
- Short-term: neutral
Disclaimer: information contained herein is provided without considering your personal circumstances, therefore should not be construed as financial advice, investment recommendation or an offer of, or solicitation for, any transactions in cryptocurrencies.


