Bitcoin and Tron Post Some Gains As Tron Foundation Prepares for TVM Launch
Aug 28, 2018, 12:18PMBitcoin, Ethereum and TRON are posting mild gains in midweek trading, as TRON Foundation Prepares for August 31 Launch of TRON Virtual Machine
The cryptocurrency market has shown some signs of recovery this week, with Bitcoin leading the way. However, we have also seen assets such as TRON making steady gains, on the back of a big event that will take place this week. So with the renewed market optimism that has been witnessed this week, what is the outlook for cryptocurrencies as we hit the mid-point mark in the last week of August?
BTC/USD
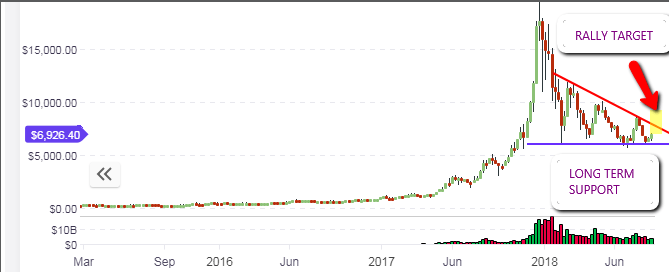
The outlook on the weekly long-term chart for BTC/USD remains unchanged. Bitcoin continues its gradual rally from the long-term support of $5,700 and is gradually approaching the $7,000 mark. At the moment, BTC/USD is testing the short-term resistance at $6,800. This level has been violated intraday, but with the daily candle still active, it is still too early to know if that level has been broken.

The daily chart captures the picture more clearly. We see that BTC/USD has three key levels of resistance that will come into play in the coming days. First, we see the short term resistance which is currently being tested. Next, we see medium-term resistance at the $7,800 mark, and we also see the long-term descending trendline resistance which is very visible on the weekly chart, which has served to restrict further uptrend of Bitcoin.

If the daily candle closes by a 3% upside penetration, then the break of the short-term resistance would have been confirmed, opening the way to further upside to the medium term resistance at $7,800.
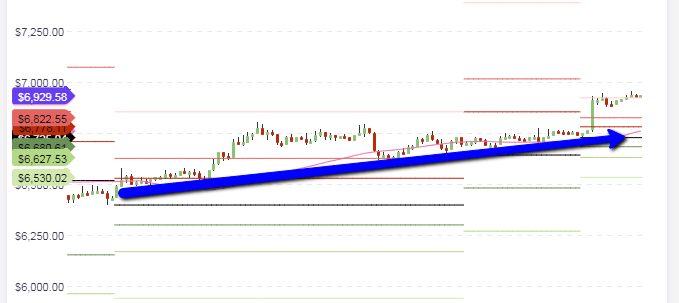
Stepping down to the intraday hourly chart, we see that the price of Bitcoin made an upward push earlier in the day to break the R1 and R2 support pivots. We see price action presently flirting with the R3 resistance at $6,929.

The intraday bias for BTC/USD is bullish. So we may see prices retreat slightly from R3 to probably take a further bounce at R2, or we may see R3 comprehensively broken as the trading activity for the day evolves. Intraday trading will, therefore, be on the basis of pivot point trading, with a bullish bias.
- - Outlook for BTC/USD
- Long-term: bearish
- Medium term: neutral
- Short term: bullish
ETH/USD
The weekly chart for ETH/USD shows that the weekly bar/candle seems to have found support at the identified horizontal support line at $280. The new weekly candlestick/bar that has opened is also trending upwards, which confirms that the $280 price level is now an established long-term support line.

The way is now open for ETH/USD to start to push upwards towards the next resistance area, which is the price level of the previous support that was eventually broken in early August. Price action is therefore expected to test this price area.

The intraday chart reveals that the price action had broken the R2 level to the upside but has been unable to breach the R3 level. Price has retreated back to the R2 level and has found intraday support there. I expect price action to make another push to the R3 level at $290.83 from present levels at R2. This should be the intraday play for today as far as ETH/USD is concerned.
- Market Sentiment:
- Long-term – bearish
- Mid-term – neutral
- Short term – bullish
TRX/USD
Today, focus is shifted to the TRON, which is listed as TRX/USD. Good things have been happening for this cryptocurrency. Recently, the CEO announced a partnership with CoinPayments platform that will see TRX being used as an alternative payment method for the 22million customers on that site. August 31 will also see another major event for the company, as they launch the Tron Virtual Machine (TVM). News has been generally positive for TRX/USD.

On the weekly chart, we see TRX/USD starting to break above the upper channel line. This represents a major shift in the long-term outlook for this currency. If the weekly candle closes above the upper channel line with at least a 3% penetration, then the long-term upside reversal would have been confirmed.

The daily chart reveals the presence of a downside channel, with price starting to push towards the upper channel line. Price action will encounter some key resistance areas. These are the upper channel line, as well as the medium-term resistance at slightly less than the $0.03 mark. Beyond this point, we also see a medium-term resistance at slightly above the $0.04 mark. The price action has to break above the $0.03 horizontal resistance before it attempts to hit the upper channel line.

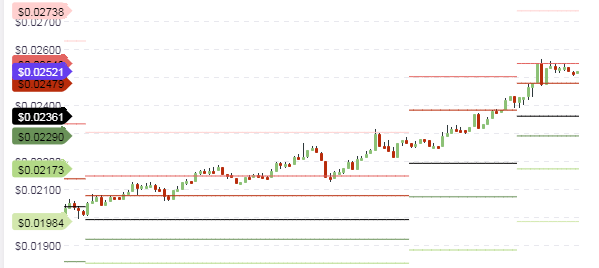
Intraday, we see that the price action has continued in the strong upward trend that it has maintained the whole week. Today, TRX/USD has found resistance at the R2 support line. With the bias for the day being bullish, it is expected that price action may retreat to R1 before making another upside push towards R2. However, a break of the R2 resistance will see prices pushing towards the R3 level at close to $0.026.
- The outlook for TRX/USD
- Long-term: neutral
- Medium-term: neutral to bullish
- Short-term: bullish
Disclaimer: information contained herein is provided without considering your personal circumstances, therefore should not be construed as financial advice, investment recommendation or an offer of, or solicitation for, any transactions in cryptocurrencies.


