
Bitcoin Bulls Pushing Prices Against Strong Headwinds: Market Analysis, Sep. 13
Sep 13, 2018, 11:20AMBitcoin bulls finding it tough to make headway in the market, while Ethereum is making a slight comeback after a terrible Wednesday.
There may be strong winds impacting both sides of the Pacific as a result of Hurricane Florence and super typhoon Mangkhut, but the cryptocurrency markets are facing headwinds of their own. The SEC's decision to ban two cryptocurrency-related products from being traded on the U.S. markets added to an already depressed market mood. The cryptocurrency market is having a pretty difficult week, even though Thursday morning seems to have brought a little relief to the market bulls.
Here is the outlook for the rest of the week.
BTC/USD
BTC/USD’s bulls found themselves in dire straits as they found it very difficult to keep upside momentum going. Prices were range bound for much of Tuesday and Wednesday, oscillating between the $6,190 floor and the $6,300 ceiling. For range traders, this would have presented a wonderful opportunity to buy and support and sell on resistance, using the oversold/overbought indications from oscillators such as the RSI or momentum indicator. However, Wednesday evening saw prices push beyond the boundaries of this range to register more upside recovery.
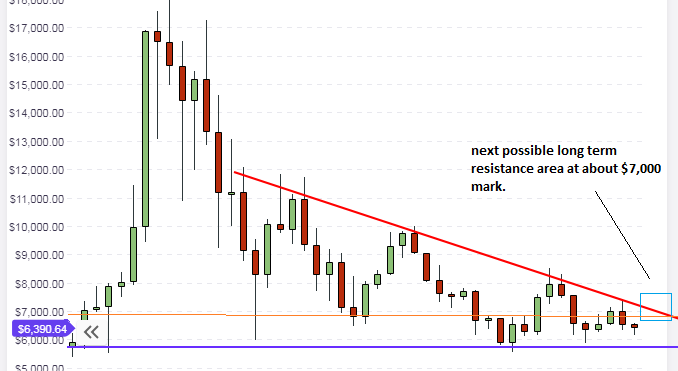
The expectation on the long-term chart is for prices to continue the same price movements that have occurred for much of 2018; rally from the long-term support line and dip from the descending resistance line. This will continue for some time. Right now, the weekly candle has evolved into a pinbar. If the weekly candle stays this way, this is expected to provide more impetus for further upside rally going into the next week. However, this rally has been relatively slow compared to the previous two rally moves from the support line, and this does not seem to be very good news for bulls expecting more significant rallies.
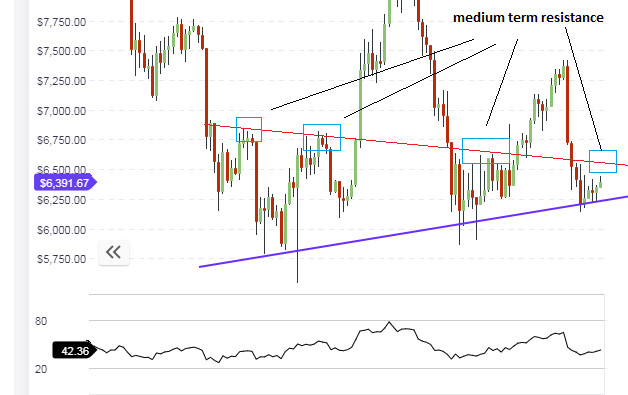
The daily chart shows that prices have started a very slow rally from the medium-term support line (shown in blue). This line continues to be the reference point for medium-term bullish price movements on BTC/USD. The next medium-term resistance to upside movement is within sight at the $6,800 mark. If this resistance level holds, then price would find itself locked in a symmetrical triangle. There would be some tests of this resistance area and if the bulls are strong enough, there may be a possible upside break of the red resistance line, allowing BTC/USD to attain the long-term highs that are expected to be seen at the $7,000 - $7,100 mark.
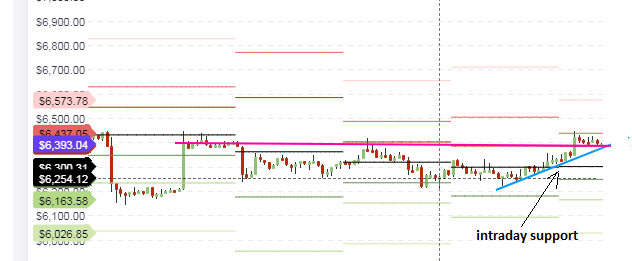
For intraday traders, the focus for trading must be the pivot points. We see that previous daily price actions for the week were contained within the pivots. The hourly chart shows that the upside limitation has now been broken, and price action will be supported at the R1 pivot, if the blue rising support line is respected. To the upside, price is still limited by the R2 pivot. We may see price action moving between the R1 pivot below, and the R2 pivot above (or even higher if bulls are able to push prices to break the R2 pivot).
Outlook for BTC/USD
- Long-term: bearish
- Medium-term: neutral
- Short-term: bullish
ETH/USD
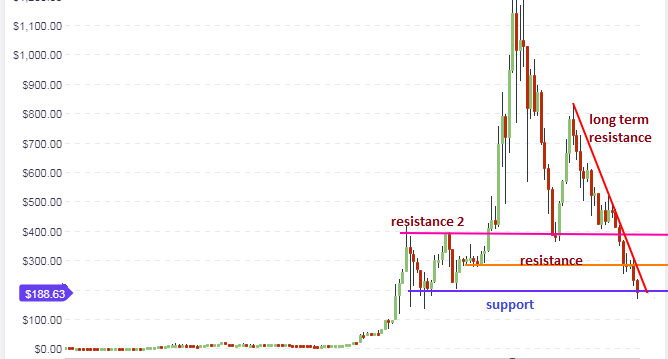
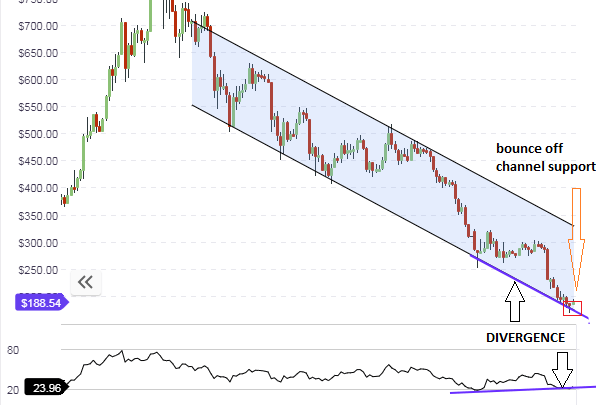
ETH/USD continues to bear the brunt of the market bearishness. On Wednesday afternoon, it touched the $165 mark and it really looked like the bottom was about to come off. However, ETH/USD has staged a recovery coming into Thursday morning and is now trading at a little lower than $190. The price action is still sitting on the support line, but only just. The support is still under severe pressure and will continue to be for some time to come. If price is able to push off from the support line, then it will target the first resistance level at $290. Other resistance areas can be seen above this, but price will have to break above the $290 mark before these other areas are seen.
The daily chart shows that the downward channel is still intact, with price having bounced off the lower channel line with a pinbar candle (red box). The price action is starting to push upwards. Naturally, we would expect price to track back upwards towards the upper channel line, but this is still a long way off, given the bearish sentiment in the market. However, the presence of the divergence opportunity seems to suggest that an upside correction is possible.
The hourly chart reveals that the price action for the week ended up forming a bullish reversal pattern known as the saucer. However, upside movement from this pattern has stalled at $187.63; a level which also corresponds to the R1 resistance. Traders will therefore have to watch for an upside break of the R1 pivot, which will open the door to a price move to the R2 pivot level of $197.53.
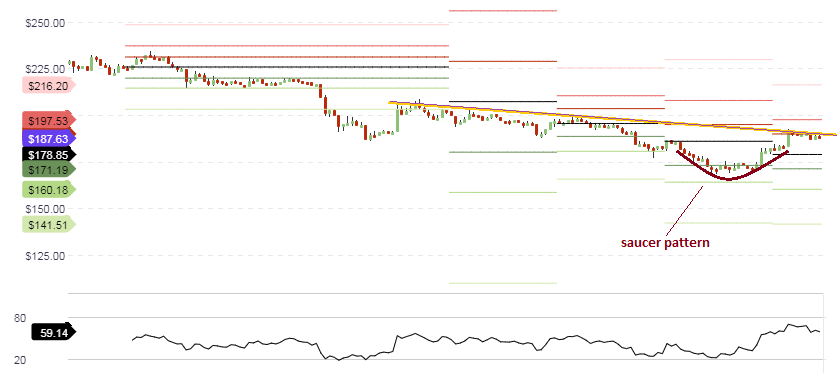
Price movements for the day are expected to stay within limited boundaries formed by the pivot points. Therefore, traders should watch the behaviors of the candles at the identified pivot points and use these as a guide to execute their intraday positions.
Outlook for ETH/USD
- Long-term: bearish
- Medium-term: neutral
- Short-term: neutral to slightly bullish
LTC/USD
LTC/USD took a major hit in Wednesday’s trading, but has been able to come off the pivot lows. The long-term chart shows that the asset is moving within the boundaries of a falling wedge. However, this pattern is still in evolution and it will take some time for this pattern to resolve. Price action is finding support at the $45 area, which is the lowest that LTC/USD has been since December 2017.
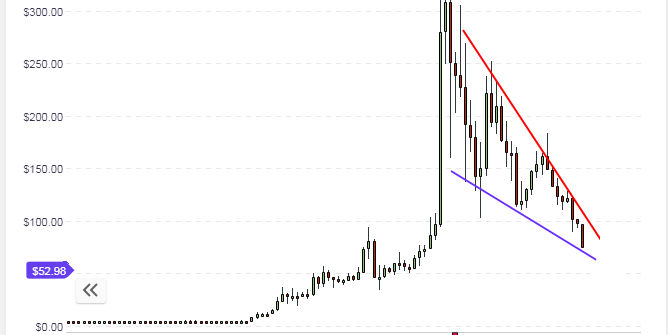
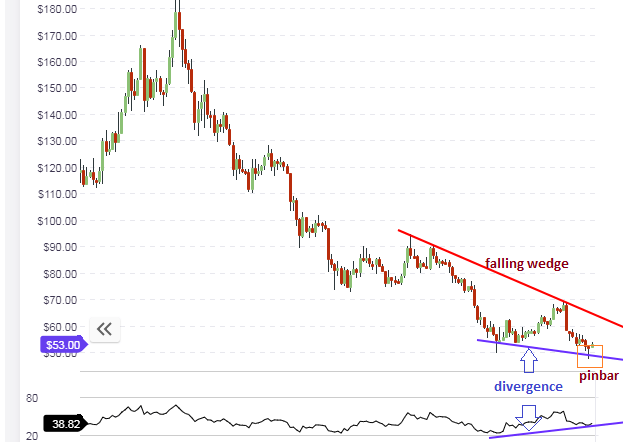
If the support line holds firm, we expect prices to push upwards from there and rally to the descending resistance line. The daily chart also shows a falling wedge pattern, with the RSI pointing upwards to show a possible divergence setup that is expected to correct to the upside. We also see that price has bounced off the medium-term support line with the formation of a pinbar. This may set the tone for continued price recovery heading into next week.
If Bitcoin prices manage some form of rally, it will drag LTC/USD along with it. Litecoin was created as a crypto which would retain Bitcoin’s basic structure, but with the addition of features to shorten transaction confirmation times. Therefore, LTC finds strong correlation to BTC prices, and this correlation cannot be ignored by traders.
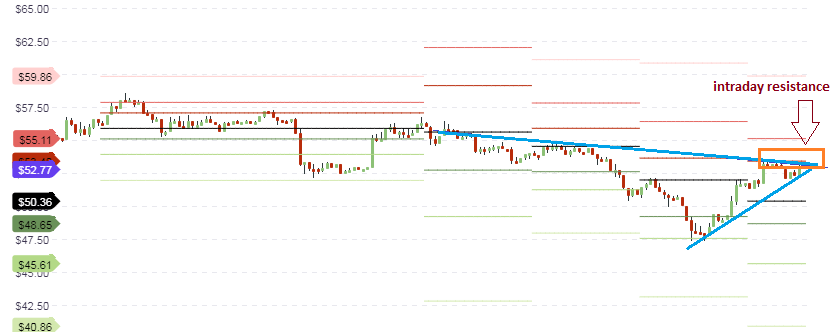
The hourly charts show prices capped by an intraday resistance line which stretches back to the beginning of the week. This resistance area is located at the R1 pivot resistance ($53.48). Price is also being supported by a rising trendline which pushes midway into the distance between the central pivot below and the R1 pivot above. Traders would be looking for a break of the R1 pivot line so as to follow prices upwards. This would be the trade setup that would be in tandem with the support bounces seen on the long term and medium term charts.
Outlook for LTC/USD
- Long-term: neutral
- Mid-term: neutral to bullish
- Shorttterm: neutral to bullish
Disclaimer: information contained herein is provided without considering your personal circumstances, therefore should not be construed as financial advice, investment recommendation or an offer of, or solicitation for, any transactions in cryptocurrencies.


