
Bitcoin Bulls Still Unable to Get a Grip on the Market, Analysis Oct. 14
Oct 14, 2018, 1:11PMBitcoin bulls still unable to shake the cobwebs off, as bearish sentiment continues to plague the crypto market but there are other opportunities
Following the big moves of Wednesday and Thursday, some quietness returned to the cryptocurrency markets. We are heading to the week’s open with a dampened mood on the market. Still, there are opportunities to make some profit if the right trade scenarios are identified. With this in mind, let’s go through an analysis of three of the top cryptocurrencies.
BTC/USD
Many of the bullish traders are still dipping their fingers in cold water after getting them badly burnt in Wednesday’s bearish movement. Perhaps if they had followed our analysis for BTC/USD in the last two weeks, they would have been using the same fingers to count some of the cash they would have made from last week’s predicted bearish break of the pattern identified in the daily chart. However, all is not lost. BTC/USD continues to respect the long term price floor and ceiling, but with a little readjustment. The long-term range seems to have narrowed, finding support at $6,050 and resistance at $6,700.
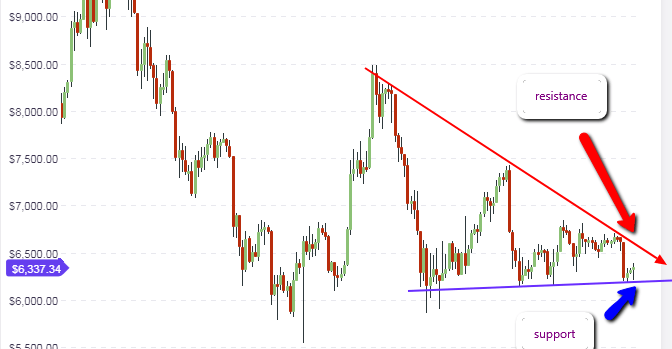
This shows that as far as the long-term focus for BTC/USD is concerned, there is still room for more downside movement if the $6,200 support line on the daily chart is broken to the downside. Presently, the daily chart support of $6,200 is holding up well. This support level would need to be violated and broken comprehensively for us to see further slide down to the $5,800 long-term support area.
The last three weeks of price movement have also created some adjustment to the support and resistance lines on the daily chart. Price is expected to find medium-term support at below $6,700, and resistance at $6,050. We can see that price has bounced off Friday’s lows and is starting the slow march to the upside. A concerning situation for the Bitcoin bulls has to be the fact that the resistance levels are gradually getting lower, which is exerting downside pressure on the price. Therefore, we expect any price bounces off the $6,050 mark to find resistance at $6,650, if the current market situation persists. It may take several days of price action before we see prices push to the upside limits.
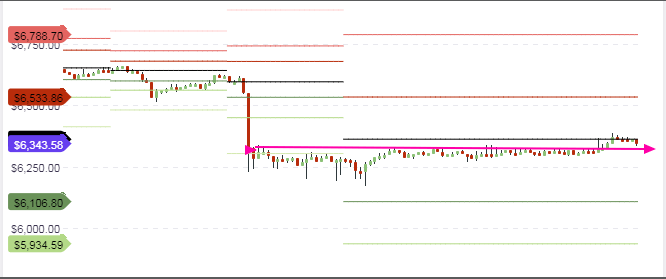
It is getting safer to place intraday trades, as some of the extreme choppiness seen on the hourly chart in the last few days has begun to give way to more discernable price action.
However, price action is still trading within very narrow ranges, with price resistance for the day located at the central pivot point ($6,350). It may be safer to allow trading for the week to kick in fully as from Monday before intraday positions are assumed. Current price action is too narrow to allow for profitable intraday trades, given the very high spreads that the BTC/USD pair attracts on many brokerage platforms.
Outlook for BTC/USD
- Long-term: neutral
- Medium-term: neutral
- Short-term: neutral
NEO/USD
Today, we take our first look at NEO, which is one of the cryptocurrencies that surprised many by its stellar price movements in the latter part of 2017. However, it is one of those cryptos that have taken a massive hit. It went from $12 to a high of $232, and is back down to $16 in a space of 1 year. This has been a roller coaster of some sorts. But the weekly chart shows that there is some upside promise for this pair, as price is presently at support levels that have not been seen in close to a year.
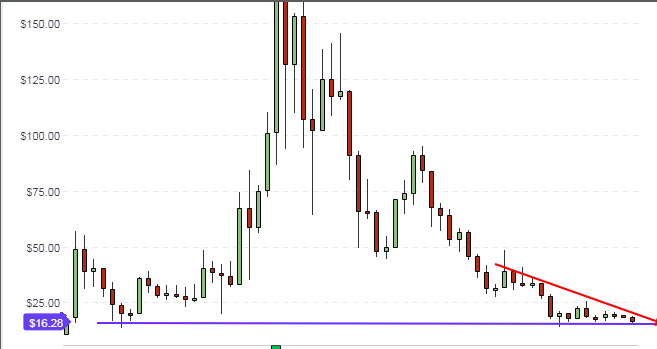
With prices now at long-term support, what does the daily chart tell us? We can see that price action has started to turn upwards. The first medium-term resistance that could be encountered is seen at the $19.50 price area. Therefore, we expect the price action to hit this level within the next two weeks. A break above this area would see price chasing the next horizontal resistance at $23.
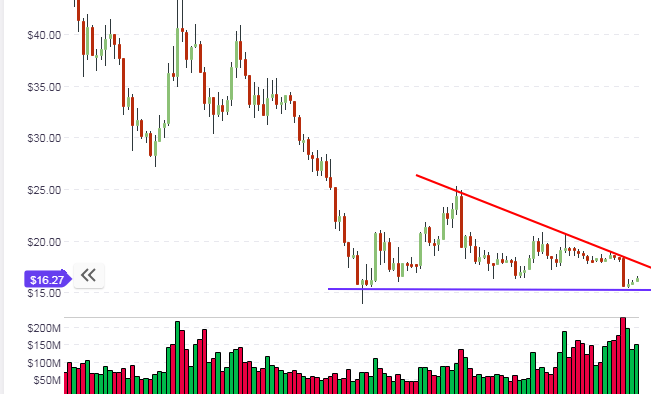
The intraday charts show some good range between pivot points, which is expected to provide some opportunity for trading off the pivots. Price has already found intraday resistance at the central pivot line of $16.67. Price action for the day is expected to trade within narrow ranges, and within the central pivot and the S1 support. Watch for further tests of the central pivot. A violation of the central pivot will see price pushing to the R1 resistance pivot at $17.68.
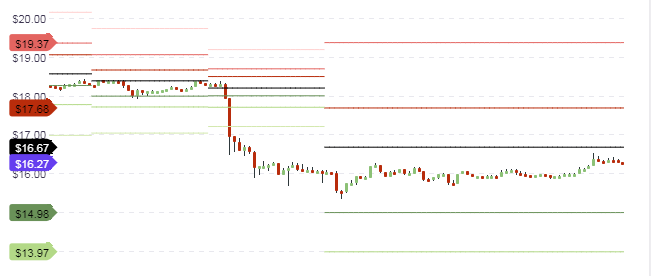
If the price fails to break the central pivot following further tests of that area, then the range of trading for the day will remain between the central pivot to the upside, and the S1 pivot to the downside.
Outlook for NEO/USD
- Long-term: neutral
- Mid-term: neutral to bullish
- Short-term: neutral
EOS/USD
EOS tested the support area of $4.80 as predicted last week, and has been able to bounce off that area. With a few hours to the close of the current weekly candle, it is safe to say that price has finally found some support and may be poised for an upward push.
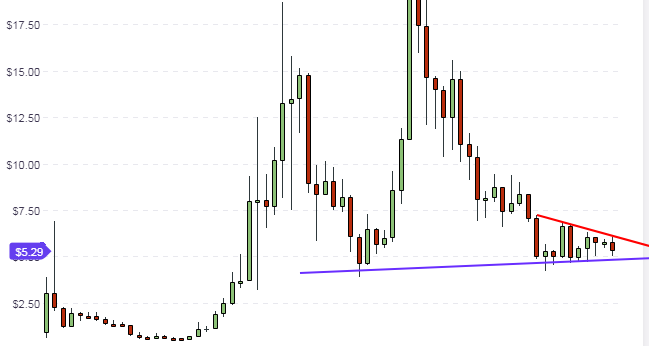
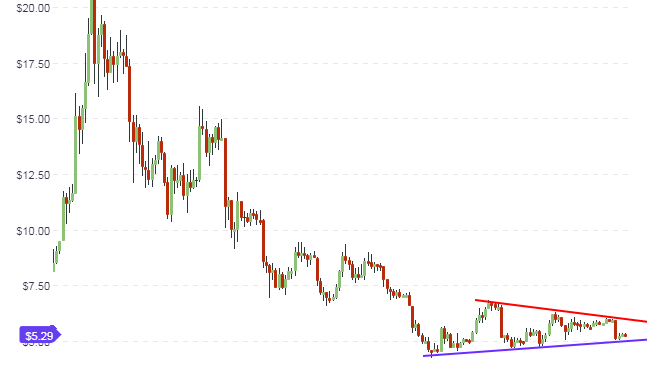
The daily chart shows that the ascending support line and descending resistance line identified in our last analysis continue to remain valid. Price action is expected to trade within these boundaries for some time to come, until there is significant market news to cause price to break to the upside or break down to the downside.
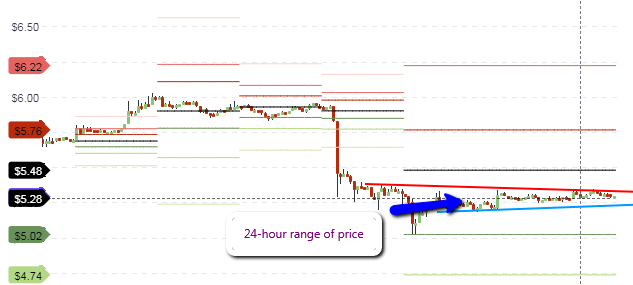
Intraday price action is very limited. The 24-hour trading range was less than 10 cents. Therefore, it may be safer to allow market activity to pick up as from Monday, before attempting new trades.
Outlook for EOS/USD
- Long-term: neutral
- Medium-term: neutral
- Short-term: neutral
Disclaimer: information contained herein is provided without considering your personal circumstances, therefore should not be construed as financial advice, investment recommendation or an offer of, or solicitation for, any transactions in cryptocurrencies.


