
BTC Back to Where It Belongs after Knee-Jerk Surge, Market Analysis Oct. 16
Oct 16, 2018, 11:51AMHopes of Bitcoin bulls appear to have been dashed Again, as sellers force BTC to retreat to price levels of last few weeks.
Early risers on Monday last would have seen some very bizarre moves in the cryptocurrency market. Bitcoin and several other cryptos surged to prices that have not been seen in over two months. But if you thought that BTC had finally woken up from its slumber, you might want to reconsider. These moves really had nothing to do with the strengthening of BTC, but had more to do with other factors, as we will identify shortly.
BTC/USD
Many of the Bitcoin bulls who must have by now cooled their burnt fingers with several dips in cold water, must have thought that their luck had turned with yesterday’s massive spike in prices. BTC surged from $6,168 to $7,800 in two hours of early morning trading on Monday. The price surge was probably due to a selloff in the Tether coin, which had up till now been tagged as the crypto that was pegged to the US Dollar and which by definition, should be at parity with the USD in terms of exchange value. That parity was nullified by the selloff, with Tether falling to as low as 85 cents to the US Dollar.
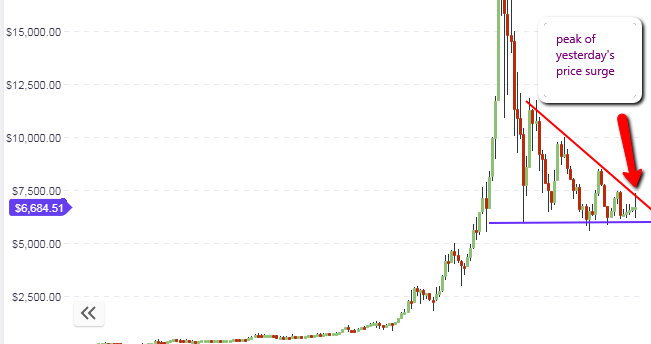
This prompted a safe haven demand for Bitcoin and several cryptocurrencies which are linked to Bitcoin, causing it to spike to as high as $7800. However, this proved to be a transient move as it was not supported by any fundamentals to BTC, prompting a retracement back to the trading ranges of the last two weeks. Presently, BTC is pushing against last week’s resistance of $6,650.
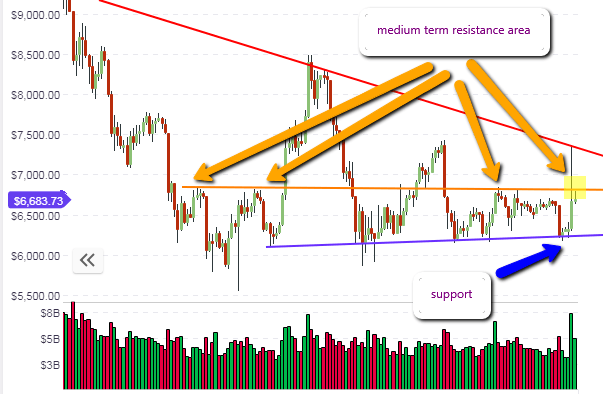
The daily chart continues to show well-demarcated support and resistance lines. Yesterday’s price move only touched the resistance line, and did not break it. So we continue to see BTC trading within the range with the floor and ceiling shows as $6,000 and above $7,200 respectively.
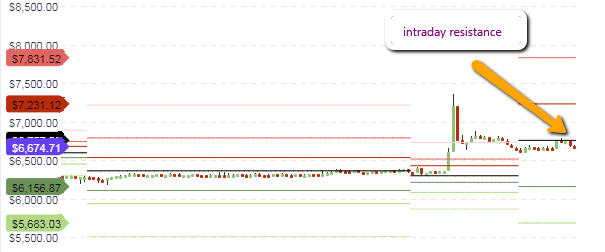
Intraday trading volume is very thin. Conditions do not favour day trading, so it is best that traders follow the action on the daily chart, trading off the support and selling off the resistance levels, assuming the price candles do not break these areas. BTC will most likely continue to trade off the floor and will be rejected at the resistance, as long as there is no basic change in the fundamentals.
Outlook for BTC/USD
- Long-term: neutral
- Medium-term: neutral
- Short-term: neutral
BCH/USD
Being linked to Bitcoin, Bitcoin Cash also partook of yesterday’s price spike, but this was also shortlived, with the Bitcoin-fork asset only getting to as high as $630 before it came tumbling down again. This is captured in the weekly chart where the active candle only came close to the resistance area, before pulling back down again. Therefore, the long-standing support and resistance areas continue to remain intact as indicated by the horizontal trendlines.
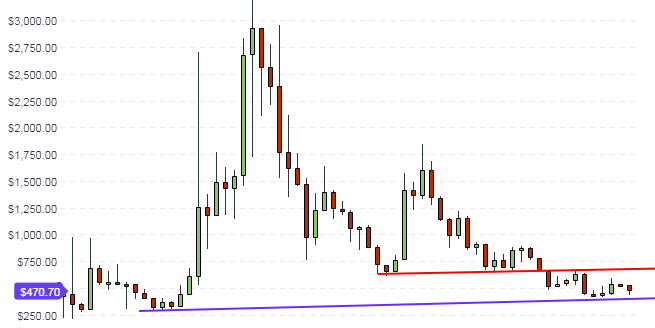
The daily chart of BCH paints a clearer picture, with price located in the middle of the range. The price floor and ceiling continue to be found at the $430 and $525 price levels respectively. Trades made from the daily chart must be made off these price extremes, provided the active daily candles do not break these areas. Therefore, look for a price bounce from the floor, or a price rejection at the ceiling, if there are no changes in the fundamentals of BCH.
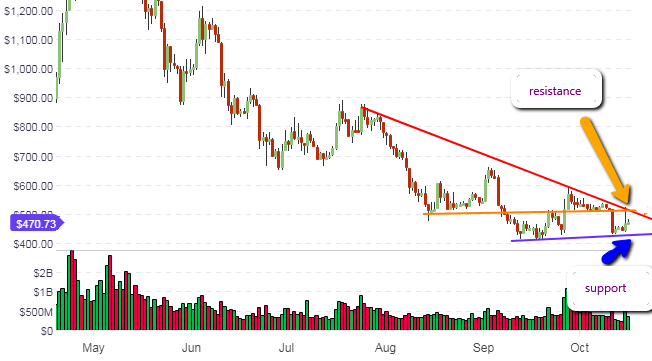
The intraday charts show low volume trading within narrow ranges, with price being rejected at the central pivot price of $480. For any upside price movement to occur for the day, price action must break above this level.

This is unlikely as far as trading for Tuesday is concerned, therefore we look for a price trade range from the central pivot all the way down to the S1 pivot. Opportunities for the day are likely to be very few and far between, and intraday traders may be well advised to wait for an improvement in trading volume before diving in.
Outlook for BCH/USD
- Long-term: neutral
- Mid-term: neutral
- Short-term: neutral
EOS/USD
The focus for EOS is unchanged. The weekly chart continues to respect the identified support and resistance price levels. This is likely to remain the situation for this week. However, November may bring some changes as price evolves towards the apex of the symmetrical triangle shown. At that time, a breakout is expected to occur.
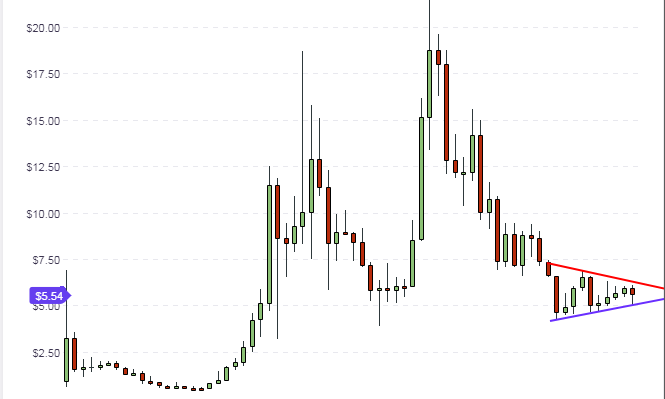
The daily chart shows that the ascending support line and descending resistance line identified in our last analysis continue to remain valid. Price action is expected to trade within these boundaries for some time to come, until there is significant market news to cause price to break to the upside or break down to the downside.
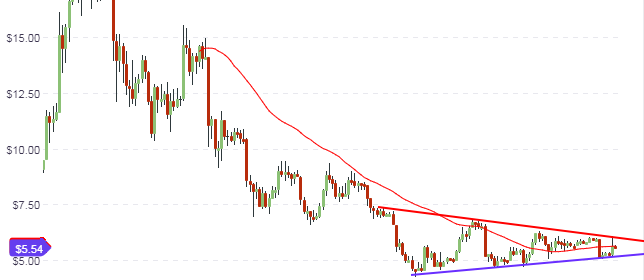
Intraday price action is very limited, with few opportunities to profit. At the moment, there is not enough volatility to stimulate the sort of price differentials that would create a trading opportunity. Intraday traders are advised to await better price action before trading.
Outlook for EOS/USD
- Long-term: neutral
- Medium-term: neutral
- Short-term: neutral
Disclaimer: information contained herein is provided without considering your personal circumstances, therefore should not be construed as financial advice, investment recommendation or an offer of, or solicitation for, any transactions in cryptocurrencies.


