
BTC, BCH Continue to Post Gains, while for TRX HODLers, the Wait Continues: Sep. 2
Sep 2, 2018, 11:38AMBitcoin & Bitcoin Cash continue to experience some price advances as the week draws to a close, but TRX HODLers will have to wait a little more.
The cryptocurrency market continues to bask in the upside recovery that was witnessed this week, as BTC, ETH and other cryptos march towards key resistance areas. What does the first week of September 2018 hold for the crypto markets?
BTC/USD
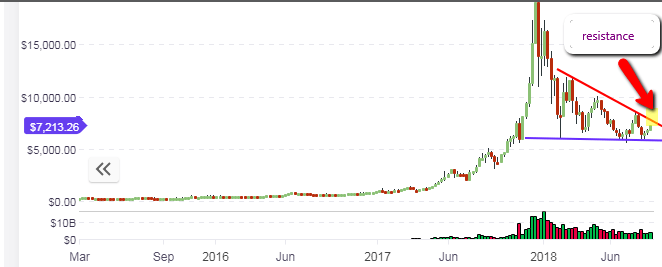
The weekly BTC/USD chart shows that price action continues to remain within the boundaries of the triangle that has been identified. As has been the pattern for several months now, price action has bounced off previous lows and is heading towards the descending trend line that serves as the long-term resistance. The weekly candle looks set to close the week at above $7,200, which is very close to the resistance area. Extrapolation of the descending trendline resistance shows that the initial resistance that will be encountered by the latest upside price move will be at the $7,500 level. We expect this level to be attained this week and tested several times if the upside momentum continues.
Day traders who want to take on their trade positions should be aware that there may not be much upside left in the long-term move before price stalls or even retreats. However, the intraday chart shows that the price of Bitcoin is finding intraday support at the blue line shown on the chart. Price action is already trading above the R2 pivot, but has started to retrace downwards to that pivot level. If price action is able to break below the R2 pivot, then expect it to find support at R1 or at least, close with a bounce off the blue support line. Therefore, intraday trades should use the identified lines of support and resistance for the day, as well as the pivot points.
Outlook for BTC/USD
- Long-term: bearish
- Medium-term: neutral
- Short-term: limited bullishness
TRX/USD
The long-awaited and much-hyped launch of the TRON Virtual Machine has come and gone, without much of an impact in the price of the TRX/USD crypto pair. This will definitely leave HODLers of this crypto doing what they have done best since 2018; continuing to hold on for dear life. However, TRX/USD continues to be in the minds of many analysts, an undervalued crypto which may burst to life soon.
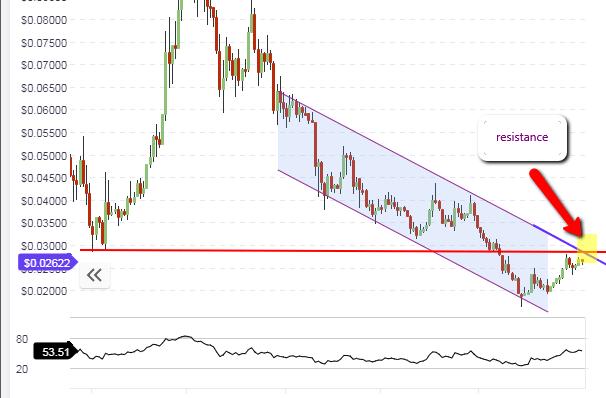
We begin our emphasis today on the daily chart, which shows that the price action has as expected, been resisted at the upper channel line. The daily candle is currently lower than it opened the day, and if it closes this way, then price would be deemed not to have broken out of the channel. This leaves the medium term direction of the TRX/USD to continue on a downward trend, following the path of the channel. The price is expected to test the upper channel line several times. If two or three more tests occur and this resistance holds firm, then this would be a good place to short the TRX/USD and follow the price back down to the lower channel line.
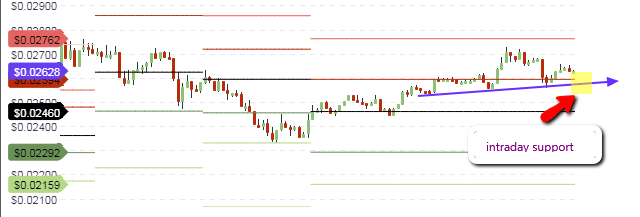
Intraday, we see that the price action is turning downwards and is probably going to find some support at the identified blue support line. This line coincidentally is expected to cross the R1 pivot of $0.02594, which will probably reinforce this area as a good intraday support. It is likely that there will be a brief upside to price action as it attempts another test of the medium term resistance located at the upper channel line. However, if the intraday support is broken at any time within the day, then expect the price of TRX/USD to attempt a push to the central pivot, within the context of a continuation of the downtrending channel.
Outlook for TRX/USD
- Long-term: bearish
- Medium-term: bearish
- Short-term: neutral to mildly bullish
BCH/USD
Bitcoin Cash continues its advance on the back of its big brother crypto and has been able to breach the previous medium-term resistance levels.
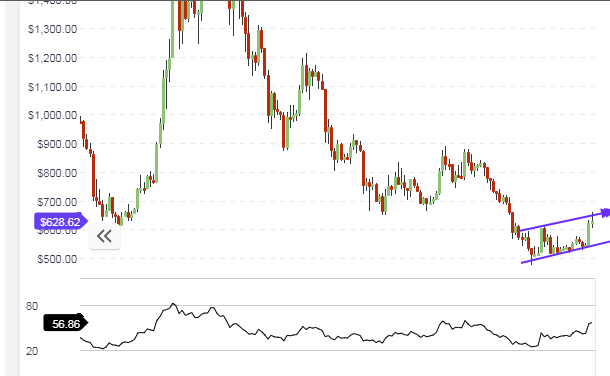
While the long-term chart shows that price action has bounced off the long-term support, the daily chart shows that the price of BCH/USD is testing the upward channel resistance line, which is also very close to the next medium-term resistance at the $680 price level. The daily candle is presently assuming the shape of a pinbar. We need to wait for the candle to close to determine if the price has broken above the upper channel line, or will retreat and remain confined to the borders of this channel.
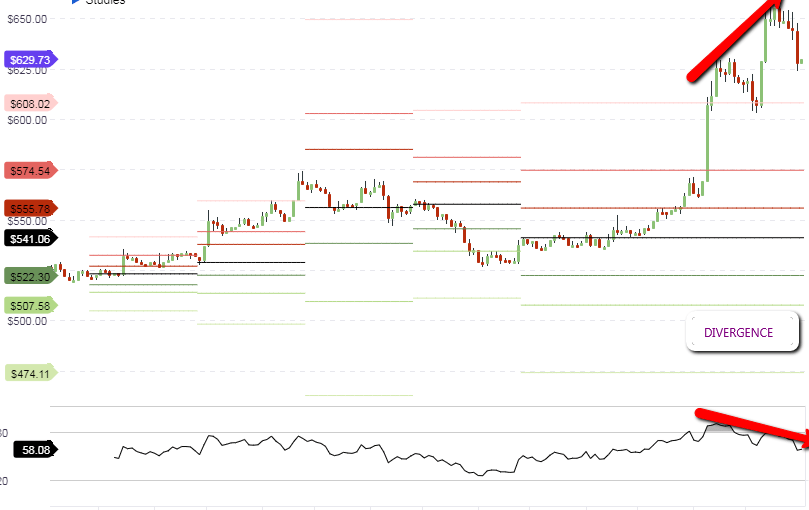
The intraday chart reveals that the price action has breached all resistance levels, but is starting to trend downwards on the back of a divergence between the price and the RSI. Therefore, price action is expected to correct downwards up to the R3 or even the R2 pivot. If this happens, then this would be seen to occur in the context of a resistance of price action at the medium term upward channel resistance line that has been identified in the chart.
Outlook for BCH/USD
- Long-term: neutral to bullish
- Mid-term: neutral
- Short-term: bearish
Disclaimer: information contained herein is provided without considering your personal circumstances, therefore should not be construed as financial advice, investment recommendation or an offer of, or solicitation for, any transactions in cryptocurrencies.


