
DCR Surges on Binance Listing, NEM Picks Up Steam Following New Partnership, Oct. 23
Oct 23, 2018, 11:47AMDCR surges nearly 50% on Binance listing, as NEM also picks up steam following new partnership with UAE Ministry of Community Development
Bitcoin and Ethereum have started the new week very much like they ended the last one: with very little movement and simply no motivation for buyers and sellers to take prices to new levels. As many inexperienced HODLers continue to rue their decision to buy into all the hype of late last year, some smart investors and traders are focusing on other lesser known altcoins and are reaping the benefits. In today’s analysis, we look at three of these coins, namely, NEM (XEM), DCR and EOS, while Bitcoin and Ethereum take a backseat for now.
DCR/USD
It is only fitting to start today’s analysis with arguably the best performer of the last two days: Decred. Decred price has taken off in a massive 48% price increase on the news that the number 1 cryptocurrency exchange by trade volume (Binance) has listed the coin for trading. This has already boosted trading volumes from $600,000 to about $6 million.
A look at the weekly chart shows the strong bounce off the long-term support line and accompanied by an increase in buying volume. Indeed, the last time we saw such high buying volume was back in April when prices climbed to as high as $120. The chart also shows that at current price levels, there is still room for upside in the long term.
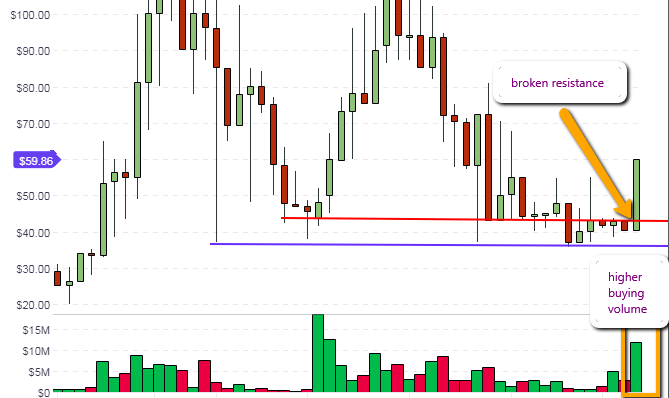
Now that the price of DCR has been “pumped” as it were, what is the likely outlook for this crypto? The daily chart gives a clearer picture of what key levels DCR is likely to attain in the coming days and possibly weeks. We see that the initial resistance price of $43.70, marked R1 on the daily chart, has been broken by this morning’s bullish price action.
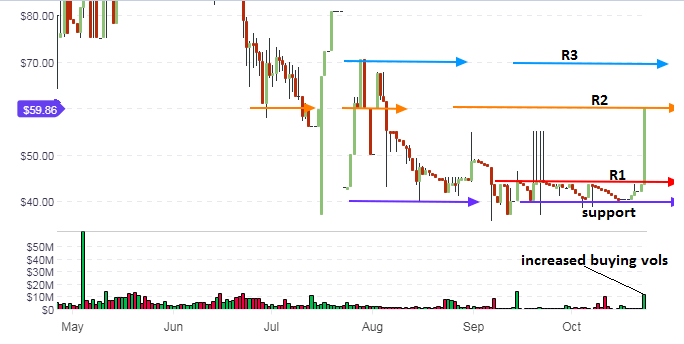
Price action candle is presently at the $59.86 mark (marked as R2 on the chart). This price level corresponds to a previous support level seen in late June/early July 2018. This price level was broken several times from the upside and downside, subjecting this price level to various role reversal functions. The last time this price level was tested from the downside was in mid-July 2018, and it is now being tested as a resistance by today’s daily candle.
It is possible that price action will test the current price resistance area at R2 several times this week. If price action is strong enough to break the price level without stress, (either today or within the week) the door will be opened for price to test the next resistance price level at the $70 mark. This area is marked R3 on the chart.
If the present resistance area proves too strong for price action, then we can expect the price action to remain rrange-bound with the $59.86 resistance (R2) being the ceiling and the previous R1 resistance level (now acting as support) to remain the floor.
It must be noted that such token listings are usually accompanied by massive price appreciation, and then a drop in prices as early token holders and those with reward bonus tokens start to offload their holdings on to the market. So traders need to be aware of this price trajectory and position themselves accordingly.
Outlook for DCR/USD
- Long-term: bullish
- Medium-term: bullish
- Short-term: bullish
EOS/USD
The EOS/USD crypto pair is presently trading inside a symmetrical triangle pattern. Price action in the last few days has found itself limited to the upside by a trendline within the triangle pattern itself. This trendline (marked in orange) demarcates previous price highs and lows of the past four months. This trendline has thus performed role reversals on various occasions, first starting off as a resistance trendline, then a support line and is currently functioning as a resistance.
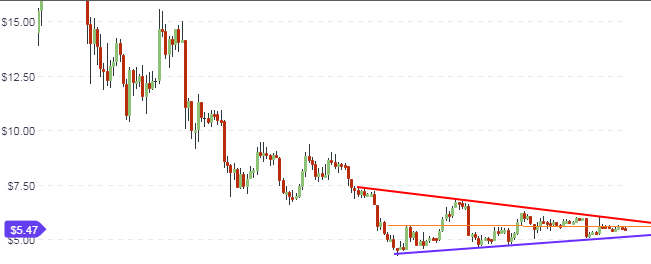
Therefore, price action must first break this trendline to the upside, before it can test the upper trendline border of the symmetrical triangle. This price move may take several days to resolve, taking the price closer to the apex from where a breakout can occur. A successful break of the triangle’s upper border will open the door for price action to test the horizontal resistance that is expected to occur at the $7 price level (marked 2R).
Price action seems to be on the upside, as the active candle is seen bouncing off the medium term support trendline. As price gets to the point of convergence of the triangle, a break is expected with ga reater bias to the upside, as the price of IOTA is already close to its long term lows.
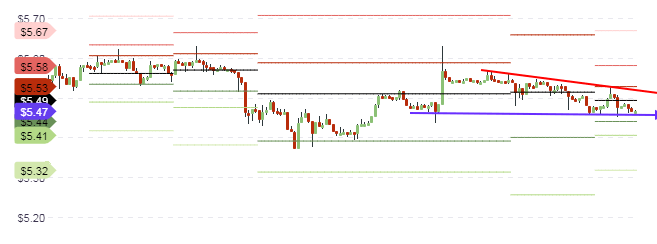
Intraday price action is expected to find support at the S1 pivot level of $5.44. This is a price area where intraday price action over the last few days has also found support. Therefore, it is expected that this support level should withstand several price tests, and possibly provide enough support for buyers to come in.
Outlook for EOS/USD
- Long-term: neutral
- Mid-term: neutral
- Short-term: neutral to bullish
XEM/USD
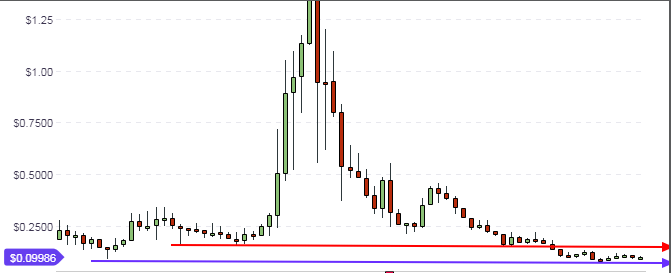
The NEM Foundation continues to make strides in increasing adoption of its token worldwide with a new major partnership deal with the UAE Ministry of Community Development. With prices of the XEM token still trading around its baseline levels an opportunity is knocking on the door for those who can take a position in this asset. The weekly long term chart reveals that the XEM asset is presently trading close to the long term support price of 9 cents. However, it is still within the long term price range formed by this support price and the red resistance line at 15 cents. Price action would need to close above this resistance for a true bullish run to kick in.
What does the medium-term focus look like? Price action is presently locked in the middle of a symmetrical triangle setup, which is inching towards the apex and getting poised for completion with an expected breakout. The daily chart provides a clearer picture of the key price levels that XEM will have to surmount in order to achieve price gains.
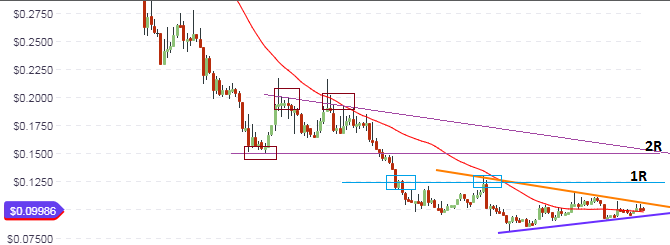
First, price would need to break out of the upper border of the symmetrical triangle. If this move succeeds, then XEM will see initial resistance at the horizontal price area of 12.5 cents. This is an area where price had previously found resistance in September 2018. Further resistance is expected to be seen at the area marked 2R, which is a confluence of the descending medium term resistance line that connects the price highs of July and August 2018, and the horizontal line that cuts across a previous support seen in early June. This is also the initial resistance that is described on the weekly chart.
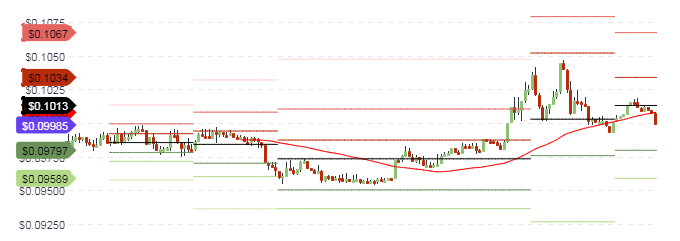
Intraday price action is expected to happen between the central pivot (10.13 cents) and the S1 support pivot below at the 9.7 cents level. Bias for the day is actually bullish, so prices may simply be looking for an appropriate support level to begin an upside push.
Outlook for XEM/USD
- Long-term: neutral
- Medium-term: neutral
- Short-term: bullish
Disclaimer: information contained herein is provided without considering your personal circumstances, therefore should not be construed as financial advice, investment recommendation or an offer of, or solicitation for, any transactions in cryptocurrencies.


