
Market Was Prepared for SEC's ETF Rejections as Top Coins Dive Mildly: Aug 23, 2018
Aug 23, 2018, 11:29AMGet Bitcoin trade alerts as well as trade setups for Ethereum and EOS for the day. Trade Bitcoin and Ethereum from support and resistance.
The U.S. Securities and Exchange Commission (SEC) recent decision to reject 3 ETF applications, making it a total of 9 rejections, has erased any hopes of short to medium term bullish moves by Bitcoin and the top cryptocurrencies. According to the SEC statement, the ETF applications by ProShares, Direxion, and GraniteShares did not meet the SEC’s requirement of putting in place mechanisms to prevent fraud and manipulation in the Bitcoin market.
Expectedly, the top cryptos took a mild dive, even though the price drops were not as pronounced as last week’s selloff. Probably, the market was not very surprised by this decision and had already priced it in.
So what is the outlook for the some of the cryptocurrencies as we head into the last weekend of August 2018?
BTC/USD
The weekly long-term chart for BTC/USD does not show much change from our last analysis. The price action is still contained within the borders of the triangle formation. Price was able to get to the $6,700 mark but has now settled at just above $6,400 on the back of the ETF rejections by the SEC. The price action is expected to maintain the present status in the absence of any strong positive influence on price action.

The picture on the intraday hourly chart below shows that the price action is being resisted at the central pivot, with gradually ascending lows. The central pivot for the day at $6,514 remains a key level of resistance, as it is located close to the resistance levels that have been seen in the last one week. Price action for the day is expected to ascend from present levels to the central pivot. If the price candle at this area is able to achieve a closing penetration above the central pivot, then the R1 pivot will be the next target for the day.
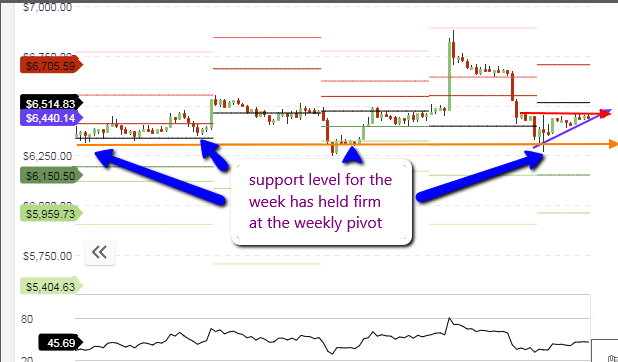
If the price action is unable to break above the central pivot, then price action will trade within the central pivot, and the S1 or even the S2 pivot. Intraday traders must therefore watch the behavior of the price bars or candle bars at the central pivot and other key areas before making their trading decisions.
Outlook for BTC/USD
- Long-term: bearish
- Medium-term: bearish
- Short-term: neutral to mildly bullish
ETH/USD
Ethereum prices do not look likely to recover anytime soon, as the status quo has not changed. The recent negative news has done nothing to help the crypto pair. ETH/USD finds itself at a price of $274 as at the time of writing this analysis and with just three days to end the week, the support level of $290 is being seriously threatened.
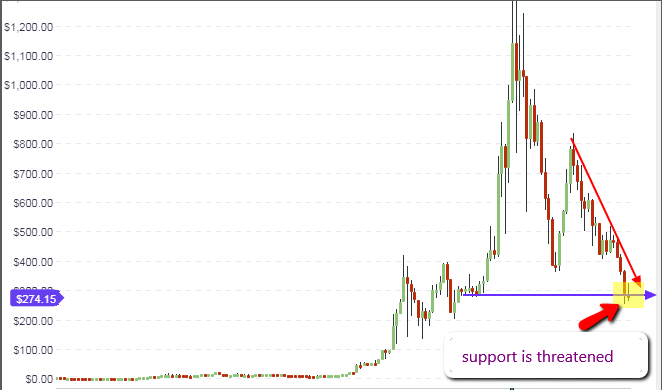
Long-term traders need to watch the current weekly candle/bar to see if it will close above or below the $280 mark. If the price closes below $280 on Sunday, then the long-term support would have been broken and we will see prices on the next weekly candle possible making a run for the next support level at $220. However, if the candle closes above $280, then we may see a gradual price recovery to the $390 support-turned-resistance area. With fewer ICOs hitting the markets and continued sales of bonuses issued during 2017/early 2018 ICOs continuing, ETH demand is yet to pick up to levels that will support major bullish recovery.
The intraday charts reveal an interesting picture which corroborates the bearish sentiment on the long-term charts. The Williams %R oscillator is presently at overbought levels, with the price action being resisted several times within the current trading day at the central pivot.
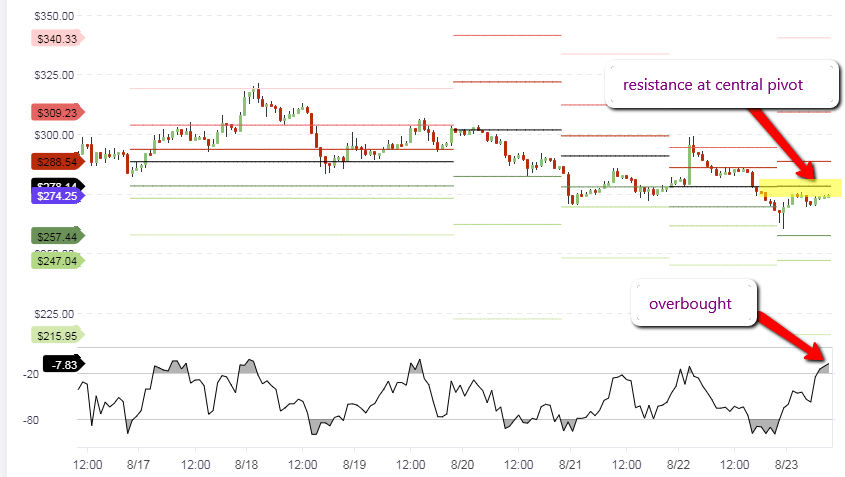
The trade play for the day would be therefore to either sell on any further rallies to the central pivot or to wait to see if a bearish divergence would occur. The divergence here would be in the form of the formation of a lower peak or a momentum failure on the indicator window, with a brief rally to the R1 pivot. If such a divergence plays out, the trade play would be to sell on the transient rally to the R1 pivot. There is not much bullish momentum in the market, so traders should look for any good setups with which to sell on the rallies.
Outlook for ETH/USD
- Long-term – bearish
- Mid-term – bearish
- Short-term – bearish
EOS/USD
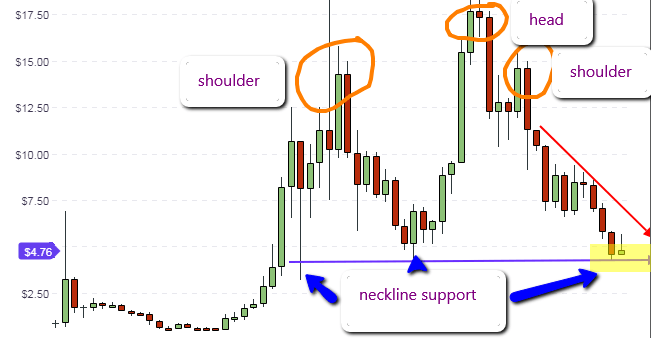
What does the long-term weekly chart on EOS/USD tell us? We can see that the price action has formed what resembles a head and shoulders pattern on the weekly chart, with price pushing against the neckline support. However, the weekly candle is gradually turning into a pinbar. It is still too early to decide on what happens at this point as we still have three days to end the week. It is only then that the shape of the weekly candle can tell us what will happen next week. If the candle stays the way it is, then a bounce on the support is likely for next week.
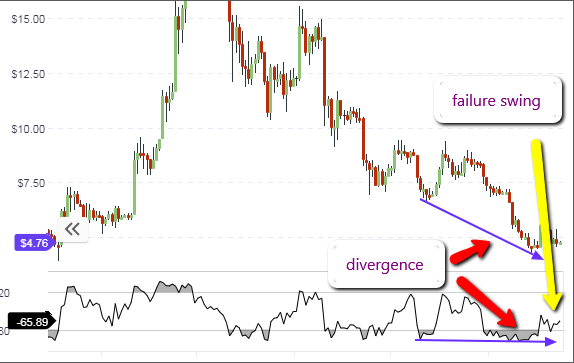
The daily chart is the focus of traders who trade for the medium term. On EOS/USD, this chart shows a pattern of divergence along with a failure swing to the downside. A failure swing refers to a situation where the oscillator line enters any of the price extreme areas (overbought or oversold), emerges out of those areas, attempts to go back in but fails to reach the critical marks. This signals a reversal, and for EOS, we can see that a reversal may be in the offing. This will be the case if the weekly candle ends up being a bullish pinbar. Barring any surprises, this setup could play out as early as next week.
The intraday picture reveals that price ascent from the S1 pivot seems to have stalled at the central pivot. We may witness a brief pullback to the S1 area if the central pivot proves too strong a resistance, or we may see a break of the central pivot if price momentum to the upside is strong enough.
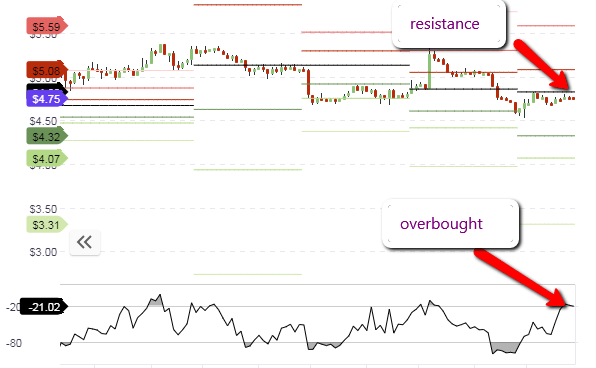
With the oscillator now in the overbought zone, it is likely that the price may first retreat to the S1 area, before heading back upwards if it finds support at S1. Traders are therefore encouraged to watch the behavior of the candles at these key levels to know in what direction to place orders.
Outlook for EOS/USD
- Long-term: neutral
- Medium-term: bullish
- Short-term: neutral to bullish
Disclaimer: information contained herein is provided without considering your personal circumstances, therefore should not be construed as financial advice, investment recommendation or an offer of, or solicitation for, any transactions in cryptocurrencies.


