
Monero Hits Temporary Roadblock But Remains Exciting, DCR, XMR, IOTA Analysis Oct. 25
Oct 25, 2018, 11:13AMMonero and DCR hit strong headwinds, which have temporarily checkmated their bullish starts to the week even as BTC continues to snooze.
Bitcoin and Ethereum still are not showing signs of the big moves that they are known to display. However, Bitcoin has been trading around the pivot points of the last few days. So intraday traders may find some joy range-trading Bitcoin.
But the real market movers have been other lesser known cryptos. After a strong start to the week, Monero and DCR seem to be cooling off. IOTA is now very close to support levels and we may see some big moves on this crypto next week. These three cryptocurrencies will form the basis of today’s analysis piece.
DCR/USD
In our last analysis piece, the key price levels for DCR were identified. The price action chart shows that on Wednesday, prices retraced to the support line (marked as 2) found on the $49 level. This was a previous resistance seen in September which was broken to the upside. This price served to provide support for subsequent price action, which as at this morning, pushed upwards to the $62.50 mark. This price level was seen as a previous support for prices way back in July 2018, but having been broken to the downside on a later date, is now performing a role reversal as a resistance point. This price level has been tested three times this week and has held well.
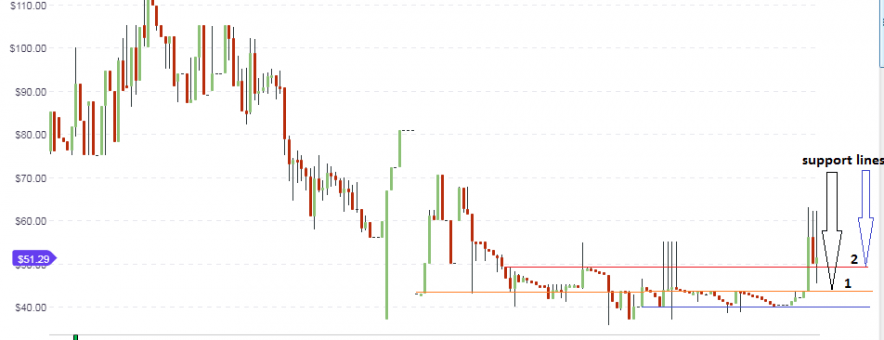
Price action has since retreated from this price level. It is expected that the $49 price level will continue to serve as support heading into the weekend, provided daily price action for this week does not violate this area. If this price level is broken, then the next support line (marked as 1) at the $43.80 mark will serve as the next support.
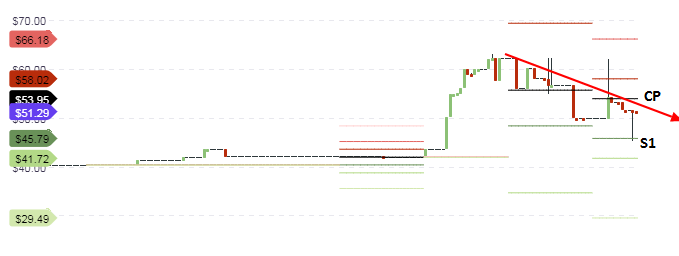
Now that the key levels on the daily chart have been identified, is there an opportunity for day traders? The intraday chart answers this question, with price action already seeing resistance at the central pivot ($53.95) and finding support with a strong bounce off the S1 pivot at $45.79. These price levels are expected to serve as the ceiling and the floor of price action respectively if the intraday candles do not violate any of these lines.
It must be noted that price action on the daily charts have been particularly choppy and the same situation may replicate itself on the hourly charts. Therefore, extreme caution should be applied in setting up the intraday positions.
Outlook for DCR/USD
- Long-term: bullish
- Medium-term: bullish
- Short-term: neutral
XMR/USD
Monero posted a strong start to the week, pushing itself to $111 in Tuesday’s trading session. However, it hit a roadblock at that level, which is an area where price had found support and is now performing a role reversal as a resistance area. We also see that the descending trendline resistance that connects the highs of the last two months intersects with this line, thus providing additional strength in resisting further upside price action.
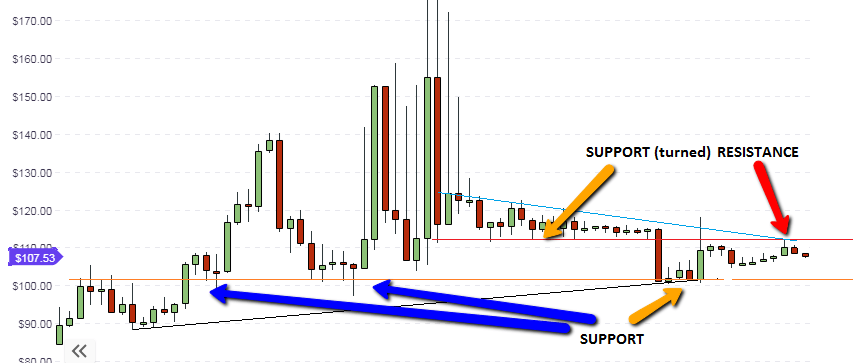
Below this area, there is a support line which connects the lows of August and September 2018. This line is expected to provide firm support for price action in the medium-term. Therefore, traders who want to trade Monero have to consider these key areas, which will serve as the medium, upper and lower ranges of price action. A push to the upside which is able to break the resistance line at $111 will open the door for a test of the $125 price area. If prices go south and are able to burst through the support line at the $100 price area, then a test of the mid-August lows seen at $89 will be on the cards.
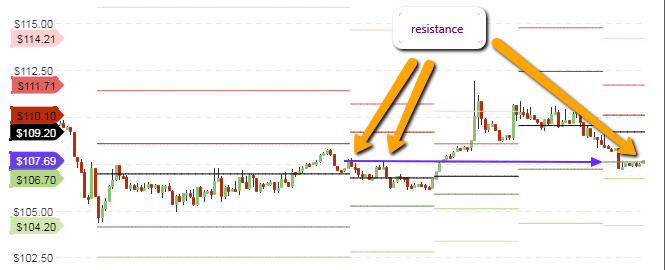
Price action on the intraday chart has broken below the S1 pivot at $106.70. Price had also found resistance here on Sunday, October 21, before it was broken by the price surge of late Monday. However, prices have been able to break below this price level, which is now functioning as a resistance. If this price level holds up, then we can expect a push of price towards the S2 pivot if sellers seize the initiative. However, if both sets of traders are undecided as to what to do, the price may continue to trade around the S1 pivot without breaking it for the rest of the day.
Outlook for XMR/USD
- Mid-term: neutral
- Short-term: bearish
IOTA/USD
IOTA, which had earlier found support at the 49.6 cents area in its pairing with USD, is gradually inching back to that support level on the back of a very thin trading volume. Price had earlier found support at this price level in August 2018. This area is expected to be tested a few times and will provide some buying impetus if the few tests of price action fail to violate this price level to the downside.
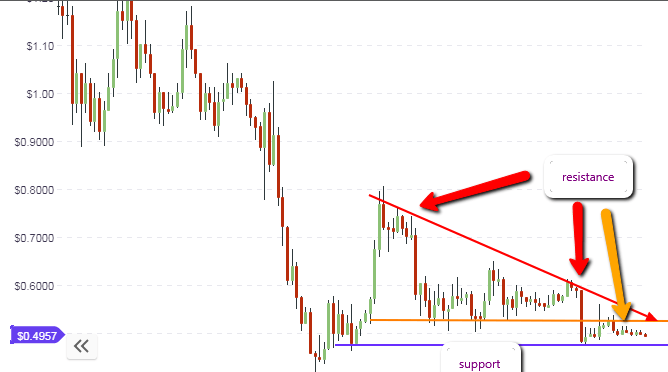
What does this mean for IOTA traders? If price is able to find some strength to bounce off this support line, the price action will find resistance at the 53 cents price area (orange line). The descending trendline resistance will also intersect the initial horizontal resistance at this level. If price breaks this level to the upside, we expect the price action to aim for the next available resistance, depicted by the thin blue line at the 64 cents mark. However, trading volumes have to pick up if any of these price moves are to be witnessed in the next few days to weeks ahead.
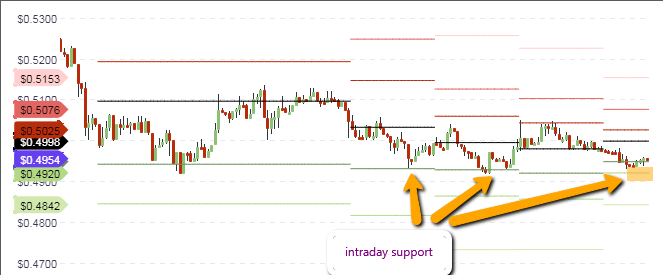
Intraday price action is expected to find support at the S2 pivot line (49.2 cents), which is also where the price found support in the last few trading days. It is worthy to note that the pivot levels have not changed much, indicating how low trading volumes have affected the ability of daily price action to experience some volatility changes. Price action is testing the S1 pivot presently. It may be better to use the S2 pivot area as a better buying price location than any other area for the day.
Outlook for IOTA/USD
- Long-term: neutral
- Medium-term: neutral
- Short-term: bullish
Disclaimer: information contained herein is provided without considering your personal circumstances, therefore should not be construed as financial advice, investment recommendation or an offer of, or solicitation for, any transactions in cryptocurrencies.


